Login takes 5minutes+
-
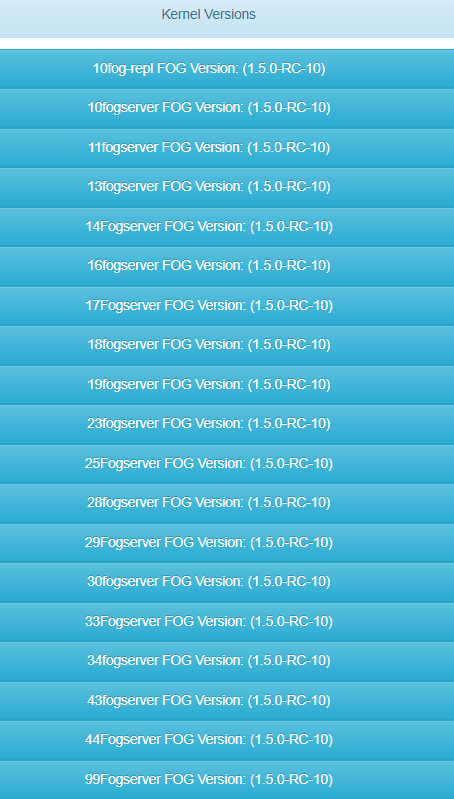
Are all of your nodes on the same FOG versions? From what I understand SQL gets a bit fussy if they aren’t.
Our district had an issue that caused us to need to roll back some to previous VM snapshots. Some of the nodes went to considerably older versions. As I updated the master, the management became terribly slow. We removed the bad nodes to later rebuild and started updating the rest. While it’s not back to normal, it is better.
With that said, following for more solutions.
-
@Greg-Plamondon @LPetelik Have you looked into MySQL connection limits yet? https://wiki.fogproject.org/wiki/index.php/Troubleshoot_MySQL#Increase_maximum_simultaneous_MySQL_connections
-
@george1421 No, because once logged in I can click on the any of the menu icons and then click the Dashboard icon and it pretty snappy
The only thing that takesquite a long time is the login process and the submitting a job. while the job looks like its hung for a 1 minute or 2 I can actually restart the PC and it will image rigt away. -
@wayne-workman Here is the apachetop
last hit: 13:03:20 atop runtime: 0 days, 00:00:25 13:03:21 All: 296 reqs ( 11.8/sec) 342.5K ( 13.7K/sec) 1184.7B/req 2xx: 296 ( 100%) 3xx: 0 ( 0.0%) 4xx: 0 ( 0.0%) 5xx: 0 ( 0.0%) R ( 25s): 296 reqs ( 11.8/sec) 342.5K ( 13.7K/sec) 1184.7B/req 2xx: 296 ( 100%) 3xx: 0 ( 0.0%) 4xx: 0 ( 0.0%) 5xx: 0 ( 0.0%) REQS REQ/S KB KB/S URL 147 5.88 284.2 11.4*/fog/management/index.php 134 5.58 1.2 0.0 /fog/service/getversion.php 9 0.39 14.8 0.6 /fog/management/other/ssl/srvpublic.crt 3 0.16 42.0 2.2 /fog/status/getfiles.php 2 0.08 0.0 0.0 /fog/service/servicemodule-active.php 1 0.33 0.2 0.1 /fog/service/PrinterManager.php``` -
@lpetelik all my storage nodes are on the same version.
-
@sebastian-roth my max_connections is set to 500 I dont know the command to check current connections.
-
@greg-plamondon More questions.
- How many (target) devices are in your network that has the FOG client loaded on them. What I want to really know is how many target computers are pinging the FOG sever every XX minutes.
- What is your checkin time (FOG Settings->FOG Configuration->General Settings->FOG_CHECKIN_TIMEOUT)
- What does the header look like in the top command?
- In the top command when you sort the list by Processor, what is the top cpu usage task during an idle state? Then what happens when you login via the web gui? Do you see a single task hammering the CPU?
- Tell us a bit about your FOG server. Is it physical or virtual? How many (v)CPU (processors/cores) does it have. What is your disk subsystem look like (technology used). How many disks, etc.
- Was there a trigger event where it was fast and then now its not?
I’m suspecting its related to the sql server, but that is only a blind guess.
-
@greg-plamondon said in Login takes 5minutes+:
  REQS REQ/S    KB KB/S URL
  147  5.88 284.2 11.4*/fog/management/index.php
  134  5.58   1.2  0.0 /fog/service/getversion.php
The main load are those two. The getversion is done by storage nodes, The other is the dashboard I think. @Tom-Elliott Ideas on this one?
-
@Greg-Plamondon About the
max_connectionssee here: https://forums.fogproject.org/post/104061 -
@george1421 We have about 300-350 devices that have the fog client on them. The check-in time is set to 60
top - 09:07:59 up 7 days, 19:33,  1 user,  load average: 1.17, 1.31, 1.43
Tasks: 252 total,   1 running, 219 sleeping,   0 stopped,  32 zombie
%Cpu(s):  8.9 us,  7.3 sy,  0.0 ni, 83.6 id,  0.0 wa,  0.0 hi,  0.3 si,  0.0 st
KiB Mem : 32781540 total, 19782616 free,  1078612 used, 11920312 buff/cache
KiB Swap:  2113532 total,  2113532 free,        0 used. 30939180 avail Mem

  PID USER      PR  NI    VIRT    RES    SHR S  %CPU %MEM     TIME+ COMMAND
 6113 mysql     20   0 4836488 318604   9824 S  17.9  1.0  16:12.44 mysqld
26475 apache    20   0  511360  18684   5876 S  11.0  0.1   4:04.53 httpd
23587 apache    20   0  511376  18644   5828 S  10.0  0.1   0:18.85 httpd
 2359 root      20   0  600128 144776   3372 S   9.3  0.4 316:39.16 FOGMulticastMan
23833 apache    20   0  405724  16412   5692 S   9.0  0.1   0:17.46 httpd
 3517 apache    20   0  509312  16592   5840 S   7.6  0.1   3:31.70 httpd
15452 apache    20   0  509312  16572   5820 S   7.3  0.1   0:28.50 httpd
 1596 apache    20   0  405724  16432   5704 S   7.0  0.1   1:41.93 httpd
20671 apache    20   0  491256  21800   8332 S   7.0  0.1   0:27.31 httpd
 1693 apache    20   0  594856  19916   8444 S   6.3  0.1   3:46.10 httpd
19659 apache    20   0  405724  16432   5704 S   6.3  0.1   0:32.84 httpd
 3532 apache    20   0  509312  16584   5820 S   3.0  0.1   3:11.70 httpd
 2363 root      20   0  337980  12456   4068 S   1.0  0.0 202:29.76 FOGSnapinReplic
  951 zerotie+  20   0    8464   5868   1148 S   0.7  0.0  17:47.85 zerotier-one
 2358 root      20   0  340028  13744   3380 S   0.7  0.0  18:23.66 FOGPingHosts
    9 root      20   0       0      0      0 S   0.3  0.0  40:21.65 rcu_sched
  460 root      20   0       0      0      0 S   0.3  0.0   6:03.11 xfsaild/dm-1
 1198 dhcpd     20   0  127524  28084   3908 S   0.3  0.1  35:55.33 dhcpd
 2362 root      20   0  337980  11652   3392 S   0.3  0.0  77:21.13 FOGSnapinHash
22067 root      20   0       0      0      0 S   0.3  0.0   0:01.76 kworker/3:2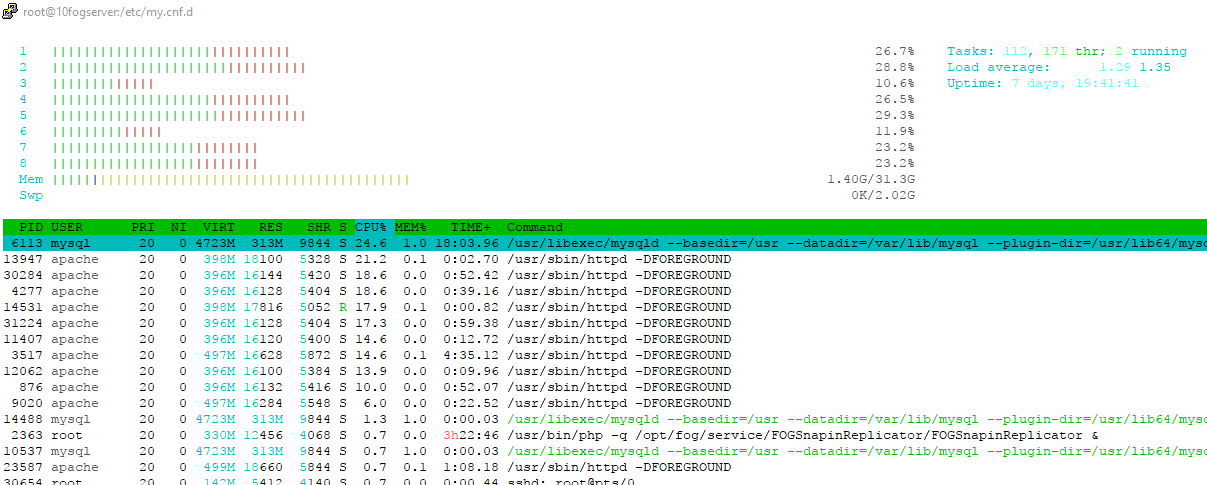
The fogserver is hosted by vmware ESXI 6.0 but its the only VM on the host.

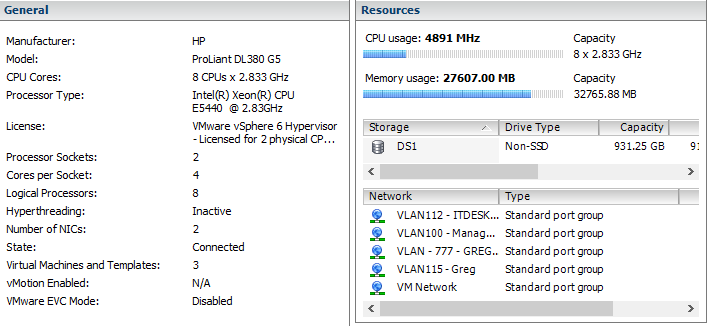
The Disks are 3 3Gig backplane 500Gig 7.2k drive in a raid 5 configuration.
Its been slow for some time I cant really think of anything that triggered it.MariaDB [(none)]> SHOW STATUS WHERE `variable_name` = 'Threads_connected'; +-------------------+-------+ | Variable_name | Value | +-------------------+-------+ | Threads_connected | 133 | +-------------------+-------+MariaDB [(none)]> show session status; +------------------------------------------+-------------+ | Variable_name | Value | +------------------------------------------+-------------+ | Aborted_clients | 0 | | Aborted_connects | 0 | | Access_denied_errors | 0 | | Aria_pagecache_blocks_not_flushed | 0 | | Aria_pagecache_blocks_unused | 15737 | | Aria_pagecache_blocks_used | 15737 | | Aria_pagecache_read_requests | 2845483 | | Aria_pagecache_reads | 390002 | | Aria_pagecache_write_requests | 350074 | | Aria_pagecache_writes | 153860 | | Aria_transaction_log_syncs | 6 | | Binlog_commits | 0 | | Binlog_group_commits | 0 | | Binlog_snapshot_file | | | Binlog_snapshot_position | 0 | | Binlog_bytes_written | 0 | | Binlog_cache_disk_use | 0 | | Binlog_cache_use | 0 | | Binlog_stmt_cache_disk_use | 0 | | Binlog_stmt_cache_use | 0 | | Busy_time | 0.000000 | | Bytes_received | 725 | | Bytes_sent | 2242 | | Com_admin_commands | 0 | | Com_alter_db | 0 | | Com_alter_db_upgrade | 0 | | Com_alter_event | 0 | | Com_alter_function | 0 | | Com_alter_procedure | 0 | | Com_alter_server | 0 | | Com_alter_table | 0 | | Com_alter_tablespace | 0 | | Com_analyze | 0 | | Com_assign_to_keycache | 0 | | Com_begin | 0 | | Com_binlog | 0 | | Com_call_procedure | 0 | | Com_change_db | 0 | | Com_change_master | 0 | | Com_check | 0 | | Com_checksum | 0 | | Com_commit | 0 | | Com_create_db | 0 | | Com_create_event | 0 | | Com_create_function | 0 | | Com_create_index | 0 | | Com_create_procedure | 0 | | Com_create_server | 0 | | Com_create_table | 0 | | Com_create_trigger | 0 | | Com_create_udf | 0 | | Com_create_user | 0 | | Com_create_view | 0 | | Com_dealloc_sql | 0 | | Com_delete | 0 | | Com_delete_multi | 0 | | Com_do | 0 | | Com_drop_db | 0 | | Com_drop_event | 0 | | Com_drop_function | 0 | | Com_drop_index | 0 | | Com_drop_procedure | 0 | | Com_drop_server | 0 | | Com_drop_table | 0 | | Com_drop_trigger | 0 | | Com_drop_user | 0 | | Com_drop_view | 0 | | Com_empty_query | 0 | | Com_execute_sql | 0 | | Com_flush | 0 | | Com_grant | 0 | | Com_ha_close | 0 | | Com_ha_open | 0 | | Com_ha_read | 0 | | Com_help | 0 | | Com_insert | 0 | | Com_insert_select | 0 | | Com_install_plugin | 0 | | Com_kill | 0 | | Com_load | 0 | | Com_lock_tables | 0 | | Com_optimize | 0 | | Com_preload_keys | 0 | | Com_prepare_sql | 0 | | Com_purge | 0 | | Com_purge_before_date | 0 | | Com_release_savepoint | 0 | | Com_rename_table | 0 | | Com_rename_user | 0 | | Com_repair | 0 | | Com_replace | 0 | | Com_replace_select | 0 | | Com_reset | 0 | | Com_resignal | 0 | | Com_revoke | 0 | | Com_revoke_all | 0 | | Com_rollback | 0 | | Com_rollback_to_savepoint | 0 | | Com_savepoint | 0 | | Com_select | 1 | | Com_set_option | 0 | | Com_show_authors | 0 | | Com_show_binlog_events | 0 | | Com_show_binlogs | 0 | | Com_show_charsets | 0 | | Com_show_client_statistics | 0 | | Com_show_collations | 0 | | Com_show_contributors | 0 | | Com_show_create_db | 0 | | Com_show_create_event | 0 | | Com_show_create_func | 0 | | Com_show_create_proc | 0 | | Com_show_create_table | 0 | | Com_show_create_trigger | 0 | | Com_show_databases | 0 | | Com_show_engine_logs | 0 | | Com_show_engine_mutex | 0 | | Com_show_engine_status | 0 | | Com_show_errors | 0 | | Com_show_events | 0 | | Com_show_fields | 0 | | Com_show_function_status | 0 | | Com_show_grants | 0 | | Com_show_index_statistics | 0 | | Com_show_keys | 0 | | Com_show_master_status | 0 | | Com_show_open_tables | 0 | | Com_show_plugins | 0 | | Com_show_privileges | 0 | | Com_show_procedure_status | 0 | | Com_show_processlist | 0 | | Com_show_profile | 0 | | Com_show_profiles | 0 | | Com_show_relaylog_events | 0 | | Com_show_slave_hosts | 0 | | Com_show_slave_status | 0 | | Com_show_status | 11 | | Com_show_storage_engines | 0 | | Com_show_table_statistics | 0 | | Com_show_table_status | 0 | | Com_show_tables | 0 | | Com_show_triggers | 0 | | Com_show_user_statistics | 0 | | Com_show_variables | 0 | | Com_show_warnings | 0 | | Com_signal | 0 | | Com_slave_start | 0 | | Com_slave_stop | 0 | | Com_stmt_close | 0 | | Com_stmt_execute | 0 | | Com_stmt_fetch | 0 | | Com_stmt_prepare | 0 | | Com_stmt_reprepare | 0 | | Com_stmt_reset | 0 | | Com_stmt_send_long_data | 0 | | Com_truncate | 0 | | Com_uninstall_plugin | 0 | | Com_unlock_tables | 0 | | Com_update | 0 | | Com_update_multi | 0 | | Com_xa_commit | 0 | | Com_xa_end | 0 | | Com_xa_prepare | 0 | | Com_xa_recover | 0 | | Com_xa_rollback | 0 | | Com_xa_start | 0 | | Compression | OFF | | Connections | 190057 | | Cpu_time | 0.000000 | | Created_tmp_disk_tables | 0 | | Created_tmp_files | 18 | | Created_tmp_tables | 0 | | Delayed_errors | 0 | | Delayed_insert_threads | 0 | | Delayed_writes | 0 | | Empty_queries | 0 | | Executed_events | 0 | | Executed_triggers | 0 | | Feature_dynamic_columns | 0 | | Feature_fulltext | 0 | | Feature_gis | 0 | | Feature_locale | 0 | | Feature_subquery | 0 | | Feature_timezone | 0 | | Feature_trigger | 0 | | Feature_xml | 0 | | Flush_commands | 2 | | Handler_commit | 0 | | Handler_delete | 0 | | Handler_discover | 0 | | Handler_icp_attempts | 0 | | Handler_icp_match | 0 | | Handler_mrr_init | 0 | | Handler_mrr_key_refills | 0 | | Handler_mrr_rowid_refills | 0 | | Handler_prepare | 0 | | Handler_read_first | 0 | | Handler_read_key | 0 | | Handler_read_last | 0 | | Handler_read_next | 0 | | Handler_read_prev | 0 | | Handler_read_rnd | 0 | | Handler_read_rnd_deleted | 0 | | Handler_read_rnd_next | 0 | | Handler_rollback | 0 | | Handler_savepoint | 0 | | Handler_savepoint_rollback | 0 | | Handler_tmp_update | 0 | | Handler_tmp_write | 0 | | Handler_update | 0 | | Handler_write | 0 | | Innodb_adaptive_hash_cells | 276671 | | Innodb_adaptive_hash_hash_searches | 0 | | Innodb_adaptive_hash_heap_buffers | 0 | | Innodb_adaptive_hash_non_hash_searches | 19 | | Innodb_background_log_sync | 1 | | Innodb_buffer_pool_bytes_data | 2359296 | | Innodb_buffer_pool_bytes_dirty | 0 | | Innodb_buffer_pool_pages_data | 144 | | Innodb_buffer_pool_pages_dirty | 0 | | Innodb_buffer_pool_pages_flushed | 0 | | Innodb_buffer_pool_pages_free | 8047 | | Innodb_buffer_pool_pages_LRU_flushed | 0 | | Innodb_buffer_pool_pages_made_not_young | 0 | | Innodb_buffer_pool_pages_made_young | 0 | | Innodb_buffer_pool_pages_misc | 0 | | Innodb_buffer_pool_pages_old | 0 | | Innodb_buffer_pool_pages_total | 8191 | | Innodb_buffer_pool_read_ahead | 0 | | Innodb_buffer_pool_read_ahead_evicted | 0 | | Innodb_buffer_pool_read_ahead_rnd | 0 | | Innodb_buffer_pool_read_requests | 464 | | Innodb_buffer_pool_reads | 145 | | Innodb_buffer_pool_wait_free | 0 | | Innodb_buffer_pool_write_requests | 0 | | Innodb_checkpoint_age | 0 | | Innodb_checkpoint_max_age | 7782360 | | Innodb_checkpoint_target_age | 7539162 | | Innodb_current_row_locks | 0 | | Innodb_data_fsyncs | 3 | | Innodb_data_pending_fsyncs | 0 | | Innodb_data_pending_reads | 0 | | Innodb_data_pending_writes | 0 | | Innodb_data_read | 4559360 | | Innodb_data_reads | 156 | | Innodb_data_writes | 3 | | Innodb_data_written | 1536 | | Innodb_dblwr_pages_written | 0 | | Innodb_dblwr_writes | 0 | | Innodb_deadlocks | 0 | | Innodb_descriptors_memory | 8000 | | Innodb_dict_tables | 8 | | Innodb_have_atomic_builtins | ON | | Innodb_history_list_length | 1 | | Innodb_ibuf_discarded_delete_marks | 0 | | Innodb_ibuf_discarded_deletes | 0 | | Innodb_ibuf_discarded_inserts | 0 | | Innodb_ibuf_free_list | 0 | | Innodb_ibuf_merged_delete_marks | 0 | | Innodb_ibuf_merged_deletes | 0 | | Innodb_ibuf_merged_inserts | 0 | | Innodb_ibuf_merges | 0 | | Innodb_ibuf_segment_size | 2 | | Innodb_ibuf_size | 1 | | Innodb_log_waits | 0 | | Innodb_log_write_requests | 0 | | Innodb_log_writes | 1 | | Innodb_lsn_current | 1604920 | | Innodb_lsn_flushed | 1604920 | | Innodb_lsn_last_checkpoint | 1604920 | | Innodb_master_thread_1_second_loops | 1 | | Innodb_master_thread_10_second_loops | 0 | | Innodb_master_thread_background_loops | 1 | | Innodb_master_thread_main_flush_loops | 1 | | Innodb_master_thread_sleeps | 1 | | Innodb_max_trx_id | 2816 | | Innodb_mem_adaptive_hash | 2217584 | | Innodb_mem_dictionary | 593780 | | Innodb_mem_total | 137756672 | | Innodb_mutex_os_waits | 0 | | Innodb_mutex_spin_rounds | 74 | | Innodb_mutex_spin_waits | 3 | | Innodb_oldest_view_low_limit_trx_id | 2816 | | Innodb_os_log_fsyncs | 3 | | Innodb_os_log_pending_fsyncs | 0 | | Innodb_os_log_pending_writes | 0 | | Innodb_os_log_written | 512 | | Innodb_page_size | 16384 | | Innodb_pages_created | 0 | | Innodb_pages_read | 144 | | Innodb_pages_written | 0 | | Innodb_purge_trx_id | 0 | | Innodb_purge_undo_no | 0 | | Innodb_read_views_memory | 88 | | Innodb_row_lock_current_waits | 0 | | Innodb_row_lock_time | 0 | | Innodb_row_lock_time_avg | 0 | | Innodb_row_lock_time_max | 0 | | Innodb_row_lock_waits | 0 | | Innodb_rows_deleted | 0 | | Innodb_rows_inserted | 0 | | Innodb_rows_read | 0 | | Innodb_rows_updated | 0 | | Innodb_s_lock_os_waits | 2 | | Innodb_s_lock_spin_rounds | 60 | | Innodb_s_lock_spin_waits | 2 | | Innodb_truncated_status_writes | 0 | | Innodb_x_lock_os_waits | 0 | | Innodb_x_lock_spin_rounds | 0 | | Innodb_x_lock_spin_waits | 0 | | Key_blocks_not_flushed | 0 | | Key_blocks_unused | 104134 | | Key_blocks_used | 3037 | | Key_blocks_warm | 440 | | Key_read_requests | 89289782 | | Key_reads | 2993 | | Key_write_requests | 42576 | | Key_writes | 3217 | | Last_query_cost | 0.000000 | | Max_used_connections | 182 | | Not_flushed_delayed_rows | 0 | | Open_files | 241 | | Open_streams | 0 | | Open_table_definitions | 89 | | Open_tables | 190 | | Opened_files | 400301 | | Opened_table_definitions | 0 | | Opened_tables | 0 | | Opened_views | 0 | | Performance_schema_cond_classes_lost | 0 | | Performance_schema_cond_instances_lost | 0 | | Performance_schema_file_classes_lost | 0 | | Performance_schema_file_handles_lost | 0 | | Performance_schema_file_instances_lost | 0 | | Performance_schema_locker_lost | 0 | | Performance_schema_mutex_classes_lost | 0 | | Performance_schema_mutex_instances_lost | 0 | | Performance_schema_rwlock_classes_lost | 0 | | Performance_schema_rwlock_instances_lost | 0 | | Performance_schema_table_handles_lost | 0 | | Performance_schema_table_instances_lost | 0 | | Performance_schema_thread_classes_lost | 0 | | Performance_schema_thread_instances_lost | 0 | | Prepared_stmt_count | 0 | | Qcache_free_blocks | 0 | | Qcache_free_memory | 0 | | Qcache_hits | 0 | | Qcache_inserts | 0 | | Qcache_lowmem_prunes | 0 | | Qcache_not_cached | 0 | | Qcache_queries_in_cache | 0 | | Qcache_total_blocks | 0 | | Queries | 7008184 | | Questions | 12 | | Rows_read | 0 | | Rows_sent | 1 | | Rows_tmp_read | 10 | | Rpl_status | AUTH_MASTER | | Select_full_join | 0 | | Select_full_range_join | 0 | | Select_range | 0 | | Select_range_check | 0 | | Select_scan | 0 | | Slave_heartbeat_period | 0.000 | | Slave_open_temp_tables | 0 | | Slave_received_heartbeats | 0 | | Slave_retried_transactions | 0 | | Slave_running | OFF | | Slow_launch_threads | 0 | | Slow_queries | 0 | | Sort_merge_passes | 0 | | Sort_range | 0 | | Sort_rows | 0 | | Sort_scan | 0 | | Ssl_accept_renegotiates | 0 | | Ssl_accepts | 0 | | Ssl_callback_cache_hits | 0 | | Ssl_cipher | | | Ssl_cipher_list | | | Ssl_client_connects | 0 | | Ssl_connect_renegotiates | 0 | | Ssl_ctx_verify_depth | 0 | | Ssl_ctx_verify_mode | 0 | | Ssl_default_timeout | 0 | | Ssl_finished_accepts | 0 | | Ssl_finished_connects | 0 | | Ssl_session_cache_hits | 0 | | Ssl_session_cache_misses | 0 | | Ssl_session_cache_mode | NONE | | Ssl_session_cache_overflows | 0 | | Ssl_session_cache_size | 0 | | Ssl_session_cache_timeouts | 0 | | Ssl_sessions_reused | 0 | | Ssl_used_session_cache_entries | 0 | | Ssl_verify_depth | 0 | | Ssl_verify_mode | 0 | | Ssl_version | | | Subquery_cache_hit | 0 | | Subquery_cache_miss | 0 | | Syncs | 12 | | Table_locks_immediate | 10617136 | | Table_locks_waited | 557 | | Tc_log_max_pages_used | 0 | | Tc_log_page_size | 0 | | Tc_log_page_waits | 0 | | Threadpool_idle_threads | 0 | | Threadpool_threads | 0 | | Threads_cached | 0 | | Threads_connected | 132 | | Threads_created | 190056 | | Threads_running | 1 | | Uptime | 8349 | | Uptime_since_flush_status | 8349 | +------------------------------------------+-------------+ -
@greg-plamondon Well there is a couple of things I see in this setup that made me squint a bit. (not in any particular order)
- You have 8 vCPUs allocated to this VM. (initial reaction: a bit overkill). But more to the point, your VM Host server is using an Intel E5440 processor. That CPU has 4 cores without hyperthreading. Lets assume that that VM Host server has 2 physical CPU chips. So that gives you 8 physical cores. That means to run the FOG VM all 8 cores have to be in a ready state to run the FOG server. So there may be a hypervisor scheduling issue on the VM host. If it was me, I would drop the vCPU count to 4, maybe 2 to start and watch the utilization.
Ref: http://www.gabesvirtualworld.com/how-too-many-vcpus-can-negatively-affect-your-performance/ - Disconnect the Centos 7 iso image from the cdrom
- You have a check-in time of 60 seconds, so that means you will have 300 some clients hitting your master fog server every minute. You may want to change that to 300 or 900 seconds. Understand the impact of this in that when you schedule snapin deployment tasks the clients won’t see the task until they check in. But in most cases a 5 or 15 minute check in for snapin deployments are not going to hurt you.
- It looks like mysql is taking a beating from the clients. You can see this in the mysql and apache high processes tasks.
- Depending on how long mysql has been in service in this fog install, we may need to run some mysql clean up and reindexing commands (I don’t have them handy at the moment)
- We might be able to help with performance by switching over to a dedicated php engine (I have a document on that I can dig up in the forums).
- Physical memory doesn’t seem to an issue with the VM so you should be good there.
I would focus on dropping the vCPU count and extending the check in periods first. Then assess the next steps.
So why is fog slow on the initial login? Its probably related to FOG creating and caching your session from the sql database that is being beat up.
- You have 8 vCPUs allocated to this VM. (initial reaction: a bit overkill). But more to the point, your VM Host server is using an Intel E5440 processor. That CPU has 4 cores without hyperthreading. Lets assume that that VM Host server has 2 physical CPU chips. So that gives you 8 physical cores. That means to run the FOG VM all 8 cores have to be in a ready state to run the FOG server. So there may be a hypervisor scheduling issue on the VM host. If it was me, I would drop the vCPU count to 4, maybe 2 to start and watch the utilization.
-
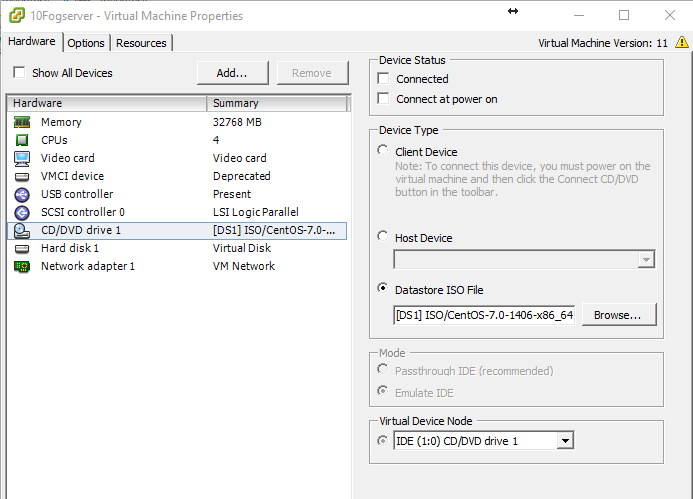
@george1421 I changed the CPU cout from 8 to 4 like you suggested.
Initial load:

Then it calmed down after a bit:

The Centos CDROM is already disconnected:
I am going to change the check-in time to 300 as suggested.I ran these commands against the DB
# No password:
mysql -D fog

#Password:
mysql --user=UsernameHere --password=PasswordHere -D fog


DELETE FROM `hosts` WHERE `hostID` = '0';
DELETE FROM `hostMAC` WHERE hmID = '0' OR `hmHostID` = '0';
DELETE FROM `groupMembers` WHERE `gmID` = '0' OR `gmHostID` = '0' OR `gmGroupID` = '0';
DELETE FROM `snapinGroupAssoc` WHERE `sgaID` = '0' OR `sgaSnapinID` = '0' OR `sgaStorageGroupID` = '0';
DELETE from `snapinAssoc` WHERE `saID` = '0' OR `saHostID` = '0' OR `saSnapinID` = '0';
DELETE FROM `hosts` WHERE `hostID` NOT IN (SELECT `hmHostID` FROM `hostMAC` WHERE `hmPrimary` = '1');
DELETE FROM `hosts` WHERE `hostID` NOT IN (SELECT `hmHostID` FROM `hostMAC`);
DELETE FROM `hostMAC` WHERE `hmhostID` NOT IN (SELECT `hostID` FROM `hosts`);
DELETE FROM `snapinAssoc` WHERE `saHostID` NOT IN (SELECT `hostID` FROM `hosts`);
DELETE FROM `groupMembers` WHERE `gmHostID` NOT IN (SELECT `hostID` FROM `hosts`);
DELETE FROM `tasks` WHERE `taskStateID` IN ("1","2","3");
DELETE FROM `snapinTasks` WHERE `stState` in ("1","2","3");


quit
I will report back with results later.
Thanks for your help. -
I forgot to mention that the Fogserver is also handleing dhcp for 4 subnets.
-
@greg-plamondon The data store file is what I should have said. The VM holds open a connection to that iso file even if its not mounted. You can see this by looking at the datastore you will see a bunch of .lck files associated with that iso.
In regards to mysql, we will probably need to rebuild and reorg the indexes and tables. Lets see how the other changes impacted the environment first.
-
@george1421
Ok, I removed the CDROM device. I don’t know how long it takes for the changes to speed things up but I haven’t seen any noticeable differences yet. -
@greg-plamondon Well for the clients to get the new checkin interval it should be 60 seconds to switch over to the 5 minute timing.
So is your sql process still at 21% with the matching http process?
If you don’t see any better performance understand that dropping your vCPUs didn’t hurt the process, even if it didn’t help it much. There is a documented penalty for over committing vCPUs to VMs either way.
-
Ok, I found the issue I was having with logging in. I had about 5 storage nodes enabled on the home screens graph, Once i disabled those I was able to login immediately. The submit a task still takes about 1 minutes or 2 but its allot better!
Thanks
-
@greg-plamondon OK it WAS the dashboard doing it to you.
I still think you can optimize your FOG install more. BUT if your issue is addressed then you can save that activity for another time. Switching over to php-fpm should lower the vCPU requirements too. BUT the biggest driver for performance was lowering the check in time to once every 5 minutes especially with 300+ nodes.
-
@george1421
I would love to optimize our FOG install if you have the time to tell me what to do.Thanks!
-
@greg-plamondon Here is a thread I was working on to see if moving to a dedicated php engine (php-fpm) over letting apache just do it, helped any. At the time I didn’t have the volume of check-ins needed to see if there was much of a change. I could tell from the responsivness of the web gui that php-fpm was working correctly. Also adding memcache would help with caching session data in memory over writting it to disk.
There is two parts here php-fpm and memcache.
https://forums.fogproject.org/topic/10717/can-php-fpm-make-fog-web-gui-fastBeyond that I feel that mysql database could also use some tuning to help with performance. But that is a personal feeling without a solid basis of evidence.