Host boot hangs at FOGSnapinHash
-
I have several Ubuntu 22.04 servers running the current dev-branch of FOG.
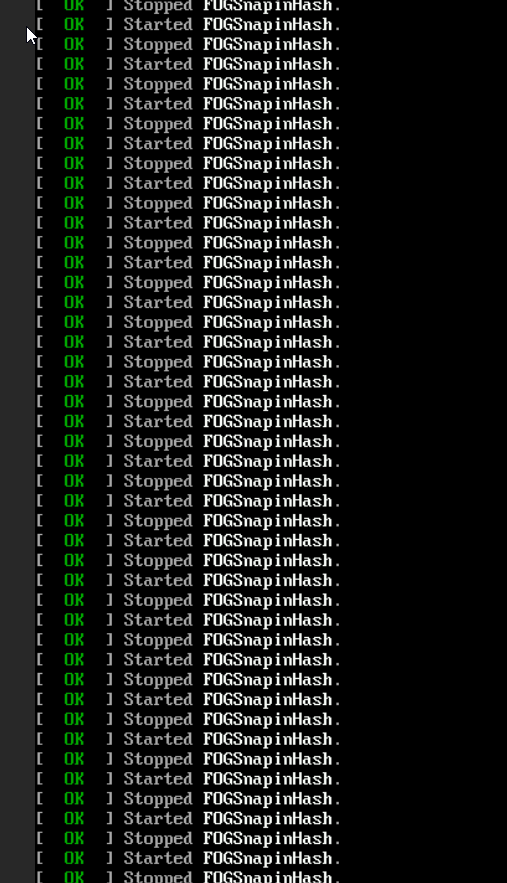
On one of these, the boot process loops a while and shows that it is starting and stopping FOGSnapinHash.
See the attached picture:

At some point, it stops doing that and finishes the boot.
FOG works normally then.What could this be due to? How can I debug it?
-
@abulhol I am using Ubuntu 22.04 with FOG dev-branch as well for testing. I have not seen this “loop” on one of my systems yet. Please provide the output of the following command after the system booted up:
journalctl --unit FOGSnapinHash --boot -
@abulhol Can you provide more information on this topic?
-
@sebastian-roth Unfortunately, this is all I could gather when the issue happened. It happens on every boot, but only on this server.
If you can let me know which logs I could collect, I’ll do that. -
@abulhol said in Host boot hangs at FOGSnapinHash:
If you can let me know which logs I could collect, I’ll do that.
You can grab the logs (since last boot) via
journalctl --unit FOGSnapinHash --boot > /tmp/snapinhash.log. -
@Sebastian-Roth I collected the journalctl log as you suggested and found this:
First there are many of this entry:
Nov 17 11:29:39 host systemd[1]: Started FOGSnapinHash.
Nov 17 11:29:39 host env[26388]: /usr/bin/env: ‘php’: No such file or directory
Nov 17 11:29:39 host systemd[1]: FOGSnapinHash.service: Main process exited, code=exited, status=127/n/a
Nov 17 11:29:39 host systemd[1]: FOGSnapinHash.service: Failed with result 'exit-code'.
Nov 17 11:29:40 host systemd[1]: FOGSnapinHash.service: Scheduled restart job, restart counter is at 762.
Nov 17 11:29:40 host systemd[1]: Stopped FOGSnapinHash.
The problem here is that
/lib/systemd/system/FOGSnapinHash.servicesays:ExecStart=/usr/bin/env php /opt/fog/service/FOGSnapinHash/FOGSnapinHashbut it doesn’t find
phpthis way, probably because at this point a full shell isn’t available yet (?).I remember reading about this issue in FOG project years ago, I don’t know if it was fixed?
There are more errors in the log afterwards, they all look like this:
Nov 17 11:29:42 host systemd[1]: Started FOGSnapinHash.
Nov 17 11:29:42 host env[27676]: PHP Fatal error:  Uncaught Exception: Missing one or more extensions. in /var/www/fog/commons/init.php:439
Nov 17 11:29:42 host env[27676]: Stack trace:
Nov 17 11:29:42 host env[27676]: #0 /var/www/fog/commons/init.php(306): Initiator::_extCheck()
Nov 17 11:29:42 host env[27676]: #1 /var/www/fog/commons/base.inc.php(46): Initiator::startInit()
Nov 17 11:29:42 host env[27676]: #2 /opt/fog/service/lib/service_lib.php(22): require('...')
Nov 17 11:29:42 host env[27676]: #3 /opt/fog/service/FOGSnapinHash/FOGSnapinHash(25): require('...')
Nov 17 11:29:42 host env[27676]: #4 {main}
Nov 17 11:29:42 host env[27676]:   thrown in /var/www/fog/commons/init.php on line 439
Nov 17 11:29:42 host systemd[1]: FOGSnapinHash.service: Main process exited, code=exited, status=255/EXCEPTION
Nov 17 11:29:42 host systemd[1]: FOGSnapinHash.service: Failed with result 'exit-code'.
Nov 17 11:29:43 host systemd[1]: FOGSnapinHash.service: Scheduled restart job, restart counter is at 764.
Nov 17 11:29:43 host systemd[1]: Stopped FOGSnapinHash.
I check the code in
init.php, but the extension mentioned there are loaded in PHP (mysqli, gettext).
I assume it is related to the other error. -
I now also checked the other services, and the funny thing is that they all have the same long list of errors, but start successfully in the end (e.g. FOGImageReplicator). Also FOGSnapinHash itself.
But only FOGSnapinHash cycle is shown on boot.I guess it could all be fixed by making
/usr/bin/env phpwork, but it’s not clear to me how to do that. -
@abulhol This is really weird. I just cannot replicate the issue for the heck of it.
but it doesn’t find php this way, probably because at this point a full shell isn’t available yet (?).
Probably right. Looks like environment.d is systemd’s part to generate the environment. I am trying to figure out how to analyze this. So I am just throwing a few commands at you and we’ll see what we find. Please run the same commands on your system and compare the outputs:
root@ubuntu2204-fog:~# systemd-analyze critical-chain
The time when unit became active or started is printed after the "@" character.
The time the unit took to start is printed after the "+" character.

graphical.target @19.463s
└─multi-user.target @19.460s
  └─FOGSnapinReplicator.service @19.447s
    └─mariadb.service @17.581s +1.755s
      └─basic.target @17.468s
        └─sockets.target @17.468s
          └─snapd.socket @17.428s +33ms
            └─sysinit.target @17.397s
              └─cloud-init.service @16.654s +738ms
                └─systemd-networkd-wait-online.service @3.060s +13.592s
                  └─systemd-networkd.service @2.966s +92ms
                    └─network-pre.target @2.960s
                      └─cloud-init-local.service @1.075s +1.883s
                        └─systemd-remount-fs.service @952ms +99ms
                          └─systemd-journald.socket @658ms
                            └─system.slice @615ms
                              └─-.slice @615ms
root@ubuntu2204-fog:~# systemd-analyze blame | head 13.592s systemd-networkd-wait-online.service 2.483s dev-sda2.device 1.883s cloud-init-local.service 1.778s cloud-config.service 1.755s mariadb.service 1.029s cloud-final.service 879ms networkd-dispatcher.service 874ms snapd.service 791ms php8.1-fpm.service 777ms systemd-random-seed.serviceroot@ubuntu2204-fog:~# systemd-analyze plot >systemd-plot.svgNow copy that SVG file to another system where you have a UI and open it (e.g. using the Linux tool
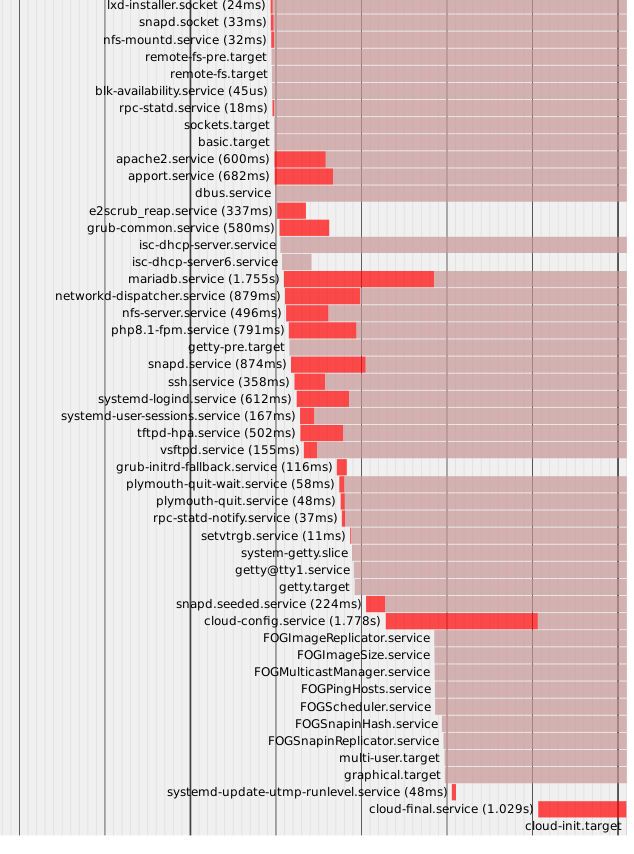
eog- here is how mine looks like (not the whole lot because that’s too big to upload here):

root@ubuntu2204-fog:~# systemd-analyze dot 'FOG*' |dot -Tsvg > systemd-dot.svg
root@ubuntu2204-fog:~# ls -al $(which php) lrwxrwxrwx 1 root root 21 Feb 22 13:24 /usr/bin/php -> /etc/alternatives/php root@ubuntu2204-fog:~# ls -al /etc/alternatives/php lrwxrwxrwx 1 root root 20 Feb 22 13:26 /etc/alternatives/php -> /usr/bin/php.default root@ubuntu2204-fog:~# ls -al /usr/bin/php.default lrwxrwxrwx 1 root root 6 Jan 28 2022 /usr/bin/php.default -> php8.1 root@ubuntu2204-fog:~# ls -al /usr/bin/php8.1 -rwxr-xr-x 1 root root 5531064 Jan 16 15:19 /usr/bin/php8.1 -
@Sebastian-Roth Thanks a lot for these troubleshooting tips!
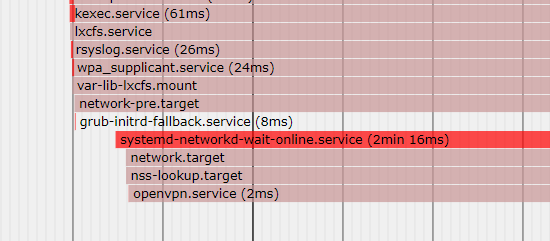
I haven’t been using systemd-analyze, quite interesting.It looks to me a bit like it’s something with the network. The SVG shows this in red:

Also, smbd was marked red by
critical-chain. I have disabled this service now, it is not needed to start on boot really.graphical.target @2min 2.330s └─multi-user.target @2min 2.330s └─smbd.service @2min 2.126s +203ms └─network-online.target @2min 2.060s └─network.target @2.156sThe output for all the PHP commands is identical on my machine.
I’ll wait for the next boot to see if disabling smbd maybe helped.
-
@abulhol Any news on this?